Update: So I let this strategy run on a Pi Zero W I had for weeks, and it never did anything. I was a little anxious I hadn't set it up right, and I was staring at the pot on the stove but forgot to turn the burner on.
Did a few tests, and sure enough, seemed like I had done it right. Mkay.
looked into it further, and it made sense. The strategy is supposed to opt-out of long-term declines unless it saw an opportunity, and that's exactly what it was doing. There just weren't any opportunities.
I moved my test install over to a VM on my main machine, got caught up exploring VirtualBox and Tiny Core Linux, and started creating a script to churn out "agent" machines that can track multiple trading options and strategies each.
Then started playing with the Genetic Algo to see if I could have a bunch of tiny VMs running scenarios on different stuff. The more data, the better idea I might have as to the general sweet spots in configurations, given certain conditions.
Got stalled out after work intensity exploded and I ran out of functional brain time - without having anything running. Just getting past that now, and hope to get the little project back into my head-space and make progress.
update: I've been doing a lot of work on tools to mass-test multi-config trading strategies across multiple trading pairs.
It's going well. I've written it up in a way to work in a cluster, so right now I have 7 VMs running on a Ryzen laptop w/ 1 core & 2GB RAMeach - each one running a thousand simulations at a time per trading pair and reporting into the primary node.
The next step is to code the analysis I've been doing by hand to infer which configurations are the most-profitable for a given trading pair during a given time period. (I have it auto-selecting the previous 100 days at the moment.
For example, I tested with a single node and 1000 simulations on a BTC-BNB trading pair: test different configurations of triple-moving-average strategies for the 100 days preceding 24 Aug 2018.
Of 1000 simulations, 76 came back with configs that 1.) beat the market - otherwise it'd be better just to HODL, and 2.) made a profit averaging at least 17.785% over 3 months - If held, this equals 200% returns per year.
I don't want to just copy the best strategy, because it's likely too well-fit to the historical data tested.
The data said:
On 60-minute candles and using 96 candles as warm-up history in a TMA strategy for BTC-BNB:
Across the top 25 performers (39.43% to 23.90% profit), the most common settings used for TMA averaging periods were short: 6 candles, medium: 44 candles, and long: 73 or 139 or 145. (I chose 139 as a median).
For the 100 days preceding 27 Aug 2018, this strategy shows sell (red) and buy (green) opportunities as follows - using only past data for each decision point (every hour):
Done with 79 trades for a 4.37% profit, during a period where the market returned -6.89%.
There was a recent uptick in the market that was not included in the original test data from 24 Aug - a great test to see if the strategy would handle it well / recommend a buy just as it took off:
So then the idea is: OK, a strategy derived from the top 25 results does well, but is it too well? Will it fall apart as time goes on, because it's too closely tailored for a specific date range int he past?
So by using all 76 results and doing the same analysis, the hope is that the strategy it recommends will be a little more middle-of-the-road: more robust and able to handle future swings adequately where the top-end one might fail completely. This likely means slightly lower but more consistent returns, which is desirable.
The results from this analysis said that for the same trading pair, same candle duration, same warm-up period and same TMA strategy, use the averaging periods of: short: 12, medium: 44, long: 122 or 145.
Changing the 'long' parameter just makes the strategy take action that much faster, which can be good or bad. I chose 145 so it would be fit as best as it could to the longest-term trends.
As of 27 Aug and the 100 days prior, these values came in at 12.36% profit over 3 months with 62 trades.
It does indeed seem that using only the top 25 configurations is too well-fit to the testing period, and the general-fit strategy seems to be better suited.
And it still caught the upswing over the last few days:
So then the question was 'how can we be sure it's more consistent, maybe it's just lucky?'
Here's the trades for each. predictably, the 'top 25' has more "good" trades, but this is the time period that created those 25, so unsurprising. Seeing how each of these do over the next 100 days will likely show the larger dataset to create a more resilient plan...?
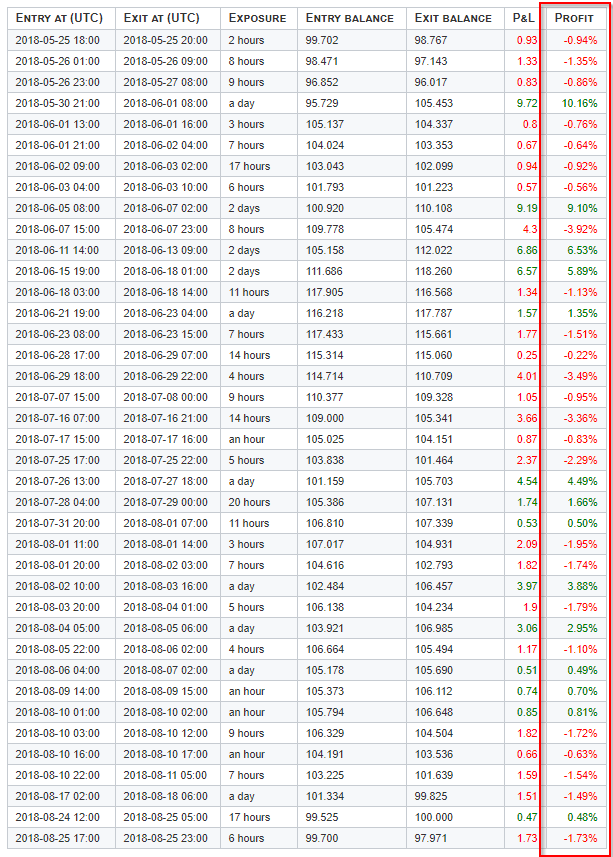
The "Top 25" Strategy's trading history:
The "Mode of 76 entries" trading history:
So it's clear this strategy is good at grabbing those upswings that result in 3, 5, 10% gains, but acts on a lot of false-positives that chip away at its profitability.
Now the goal will be to add in a block to keep the strategy from buying when the market is generally in decline. I'd be nice to have it catch every little uptick on the way down, but I haven't figured out how to do that yet.
Using the Average instead of the Mode for short/medium/long on a TMA strategy gave 13/44/101, a -5.14% return.
In TMA (and maybe others?) the relative difference between the values matters. so a 6-44-73 and a 12-44-145 from above both work well (notice the x2 relationship in both between short and long). the "average" setup shows a ~7x relationship there, and the strategy malfunctions in certain market conditions (in this case, when things are leveled - the others struggle as well, but not that badly...)
@the_technocrat I found this (old) thread super interesting, I've recently started playing around with gekko and this genetic algorithm so would love to know if you eventually managed to find a strategy that makes good gains in live trading?
The market was generally on a downward trend for a very long time, not providing great opportunities for trading. I've been trying to learn more about Machine Learning and have been putting a few bucks into a Fiverr project with an offshore dev.
Nothing workable yet, but it's basically a simplified version of a brute-force plugin for Gekko. Not sure if it's worth the small $$ I've put into it yet, not yet at the stage where it gives meaningful output. But ideally, it'll identify which strategy would have been profitable, which should identify what algorithms and trade prices are being used most often in automated trading. That should help anticipate market moves when future conditions get close to those values.

Comments
Update: So I let this strategy run on a Pi Zero W I had for weeks, and it never did anything. I was a little anxious I hadn't set it up right, and I was staring at the pot on the stove but forgot to turn the burner on.
Did a few tests, and sure enough, seemed like I had done it right. Mkay.
looked into it further, and it made sense. The strategy is supposed to opt-out of long-term declines unless it saw an opportunity, and that's exactly what it was doing. There just weren't any opportunities.
I moved my test install over to a VM on my main machine, got caught up exploring VirtualBox and Tiny Core Linux, and started creating a script to churn out "agent" machines that can track multiple trading options and strategies each.
Then started playing with the Genetic Algo to see if I could have a bunch of tiny VMs running scenarios on different stuff. The more data, the better idea I might have as to the general sweet spots in configurations, given certain conditions.
Got stalled out after work intensity exploded and I ran out of functional brain time - without having anything running. Just getting past that now, and hope to get the little project back into my head-space and make progress.
If you're interested or want to participate: https://github.com/geeklimit/gekko-research-server
update: I've been doing a lot of work on tools to mass-test multi-config trading strategies across multiple trading pairs.
It's going well. I've written it up in a way to work in a cluster, so right now I have 7 VMs running on a Ryzen laptop w/ 1 core & 2GB RAMeach - each one running a thousand simulations at a time per trading pair and reporting into the primary node.
The next step is to code the analysis I've been doing by hand to infer which configurations are the most-profitable for a given trading pair during a given time period. (I have it auto-selecting the previous 100 days at the moment.
For example, I tested with a single node and 1000 simulations on a BTC-BNB trading pair: test different configurations of triple-moving-average strategies for the 100 days preceding 24 Aug 2018.
Of 1000 simulations, 76 came back with configs that 1.) beat the market - otherwise it'd be better just to HODL, and 2.) made a profit averaging at least 17.785% over 3 months - If held, this equals 200% returns per year.
I don't want to just copy the best strategy, because it's likely too well-fit to the historical data tested.
The data said:
On 60-minute candles and using 96 candles as warm-up history in a TMA strategy for BTC-BNB:
Across the top 25 performers (39.43% to 23.90% profit), the most common settings used for TMA averaging periods were short: 6 candles, medium: 44 candles, and long: 73 or 139 or 145. (I chose 139 as a median).
For the 100 days preceding 27 Aug 2018, this strategy shows sell (red) and buy (green) opportunities as follows - using only past data for each decision point (every hour):
Done with 79 trades for a 4.37% profit, during a period where the market returned -6.89%.
There was a recent uptick in the market that was not included in the original test data from 24 Aug - a great test to see if the strategy would handle it well / recommend a buy just as it took off:
It works!
So then the idea is: OK, a strategy derived from the top 25 results does well, but is it too well? Will it fall apart as time goes on, because it's too closely tailored for a specific date range int he past?
So by using all 76 results and doing the same analysis, the hope is that the strategy it recommends will be a little more middle-of-the-road: more robust and able to handle future swings adequately where the top-end one might fail completely. This likely means slightly lower but more consistent returns, which is desirable.
The results from this analysis said that for the same trading pair, same candle duration, same warm-up period and same TMA strategy, use the averaging periods of: short: 12, medium: 44, long: 122 or 145.
Changing the 'long' parameter just makes the strategy take action that much faster, which can be good or bad. I chose 145 so it would be fit as best as it could to the longest-term trends.
As of 27 Aug and the 100 days prior, these values came in at 12.36% profit over 3 months with 62 trades.
It does indeed seem that using only the top 25 configurations is too well-fit to the testing period, and the general-fit strategy seems to be better suited.
And it still caught the upswing over the last few days:
So then the question was 'how can we be sure it's more consistent, maybe it's just lucky?'
Here's the trades for each. predictably, the 'top 25' has more "good" trades, but this is the time period that created those 25, so unsurprising. Seeing how each of these do over the next 100 days will likely show the larger dataset to create a more resilient plan...?
The "Top 25" Strategy's trading history:
The "Mode of 76 entries" trading history:
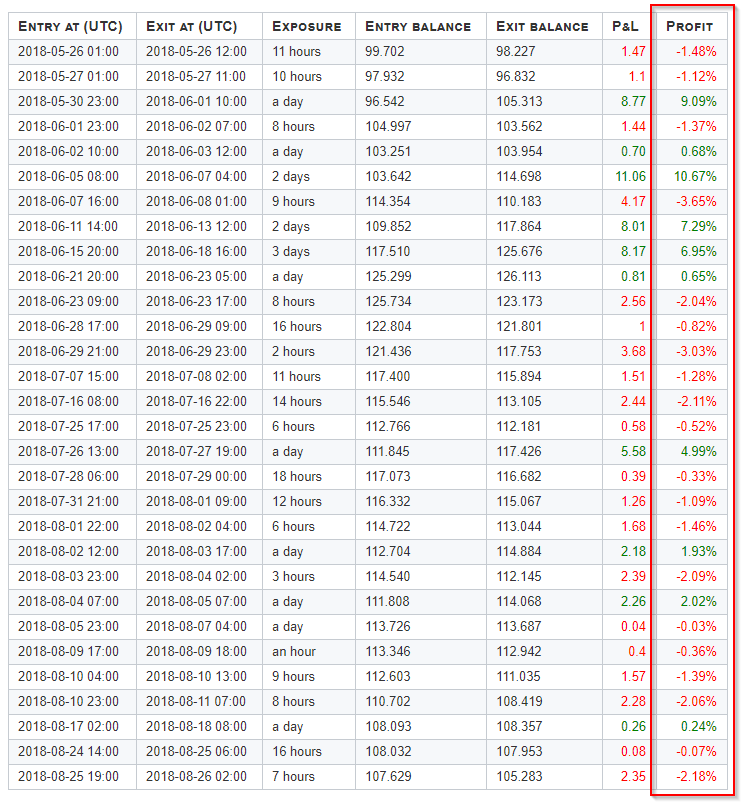
So it's clear this strategy is good at grabbing those upswings that result in 3, 5, 10% gains, but acts on a lot of false-positives that chip away at its profitability.
Now the goal will be to add in a block to keep the strategy from buying when the market is generally in decline. I'd be nice to have it catch every little uptick on the way down, but I haven't figured out how to do that yet.
And in case anyone is curious (I was):
Using the Average instead of the Mode for short/medium/long on a TMA strategy gave 13/44/101, a -5.14% return.
In TMA (and maybe others?) the relative difference between the values matters. so a 6-44-73 and a 12-44-145 from above both work well (notice the x2 relationship in both between short and long). the "average" setup shows a ~7x relationship there, and the strategy malfunctions in certain market conditions (in this case, when things are leveled - the others struggle as well, but not that badly...)
@the_technocrat I found this (old) thread super interesting, I've recently started playing around with gekko and this genetic algorithm so would love to know if you eventually managed to find a strategy that makes good gains in live trading?
The market was generally on a downward trend for a very long time, not providing great opportunities for trading. I've been trying to learn more about Machine Learning and have been putting a few bucks into a Fiverr project with an offshore dev.
Nothing workable yet, but it's basically a simplified version of a brute-force plugin for Gekko. Not sure if it's worth the small $$ I've put into it yet, not yet at the stage where it gives meaningful output. But ideally, it'll identify which strategy would have been profitable, which should identify what algorithms and trade prices are being used most often in automated trading. That should help anticipate market moves when future conditions get close to those values.